NYC foreign born population: A mosaic of global journeys
"The city is a mosaic of stories, where every street corner tells the tale of a different journey and every neighborhood serves as a living archive of global movement."
The NYC foreign born population represents a significant portion of the city's diverse identity, shaped by decades of shifting global migrations. This demographic reality creates a complex multicultural landscape where various ethnic groups find unique spaces within the five boroughs.
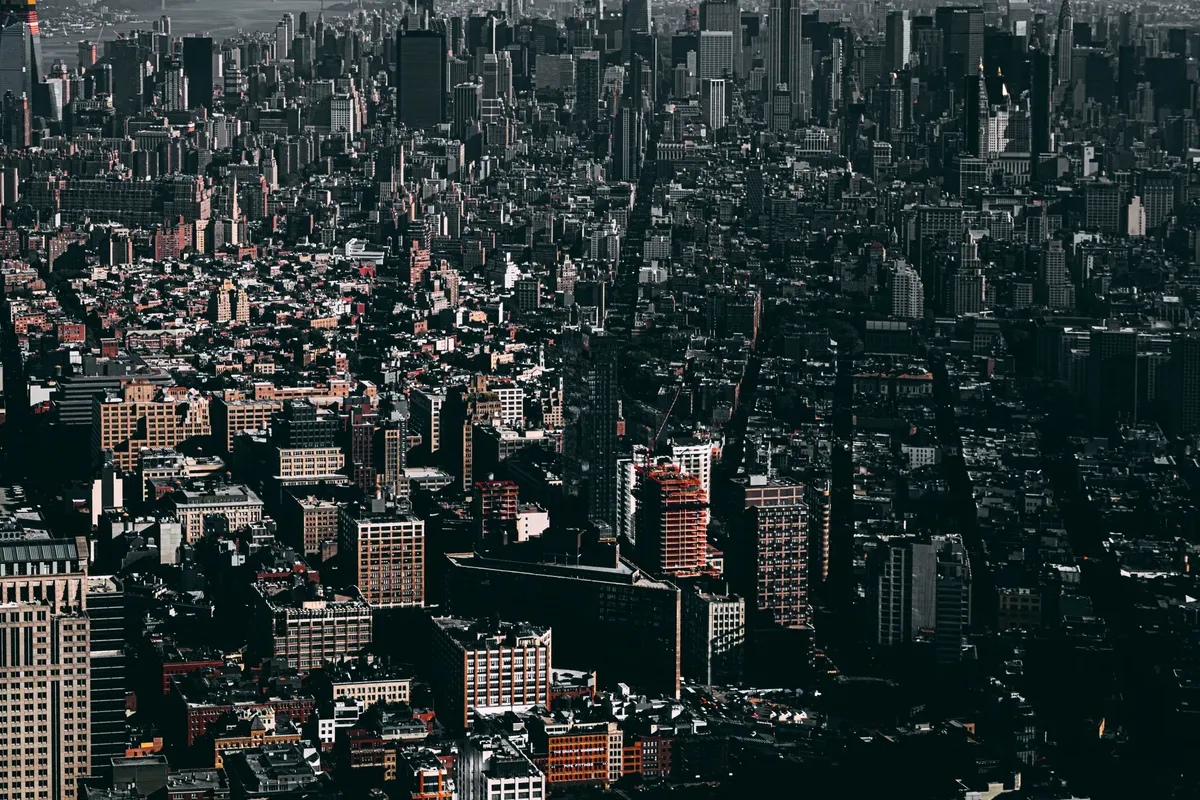
Key takeaways include the high concentration of specific ethnic groups in certain neighborhoods, the historical roots of current diversity, and the varied proportions of different heritage groups across the city.
Why is the NYC foreign born population so significant?
At sunset, a traveler leans against a railing in Manhattan, feeling the heavy heat while marveling at the massive influx of foreign faces.
A traveler walks through the crowded streets of Manhattan, feeling the pulse of a city that never stays the same. The sheer density of the population makes understanding these shifts essential to understanding the city itself.
New York is the most densely populated major city in the United States, with an estimated population of 8,584,629 in July 2025, distributed over 300.46 square miles. This density facilitates the constant interaction of different cultures.
The NYC immigrant demographics are not just numbers but the literal fabric of the urban environment. Understanding the NYC foreign born ratio requires looking at how these groups occupy specific geographic pockets.
How is the NYC immigrant demographics shaped by specific neighborhoods?
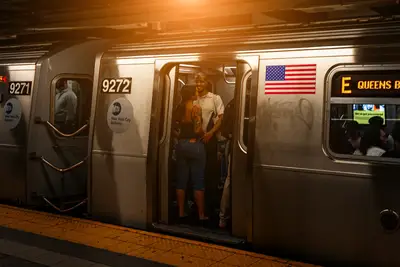
A resident navigates the subway, noticing how the language and food change from one stop to the next. This spatial distribution is a hallmark of the city's unique social structure.
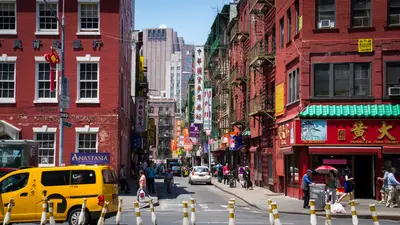
In 2020, approximately 9% of New York City's population was of Chinese ethnicity, with approximately 80 percent of Chinese New Yorkers living in the boroughs of Queens and Brooklyn alone, and over 90% living in Queens, Brooklyn, and/or Manhattan.
This concentration shows how certain ethnic groups establish deep roots in specific areas. Similarly, around 13,000 Filipino Americans and immigrants live in the Woodside area, equating to 15% of Woodside's population. These clusters create distinct cultural hubs within the larger metropolis.
What are the different proportions within the NYC multicultural makeup?
A student examines a map of the city, tracing the various lines that represent different heritage groups. The variety of the population is both broad and specific.
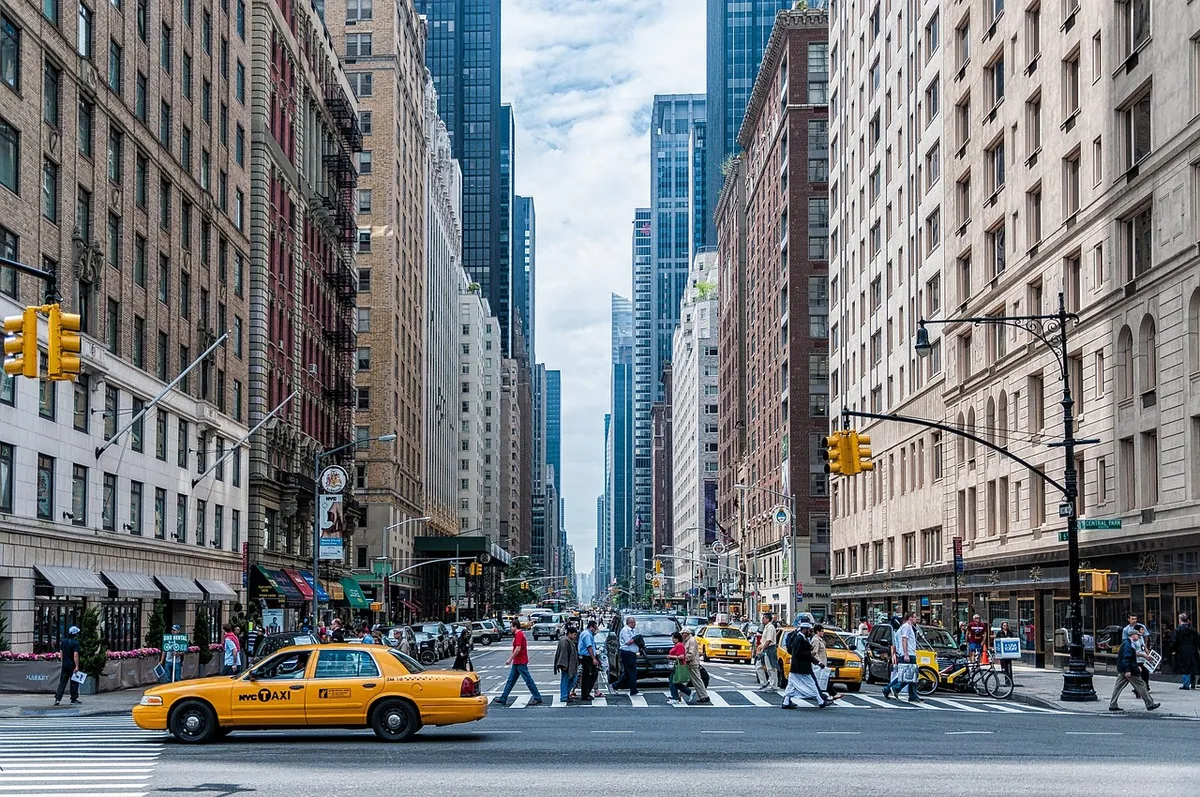
The diversity is reflected in the varying sizes of different communities.
Indian and Indian Americans comprise the largest American municipal South Asian diaspora, comprising 2.4% of the city's population, while Bangladeshi and Bangladeshi Americans and people of Pakistani heritage stand at 0.7% and 0.5%, respectively.
People of Korean heritage made up 1.2% of the city's population. Filipino and Filipino Americans were the largest southeast Asian ethnic group at 0.8%.
How do historical movements influence the NYC immigrant statistics?
A historian looks through old archives, tracing the paths of those who arrived long before the current generation. The past provides the foundation for the present.
The current landscape is built upon centuries of movement. For example, extensive immigration from the German provinces meant that Germans comprised another 25% of New York's population by 1860. These historical waves established the patterns of settlement that persist today.
The NYC immigrant statistics are a continuation of a long-standing tradition of global arrivals.
What are the specific characteristics of different heritage groups?
A visitor observes the subtle differences in the cultural expressions found in various neighborhoods. Each group brings a unique dimension to the city.
Smaller but significant groups also shape the city's character. Japanese or Japanese American heritage people are 0.3% and mostly have a presence in Manhattan. People of Vietnamese heritage made up 0.2% of New York City's population in 2010.
These nuances contribute to the complex NYC immigrant demographics.
What are the limitations of analyzing these demographic shifts?
A researcher notes the difficulty of capturing a complete picture through static data alone. Understanding the full scope of a moving population requires constant re-evaluation.
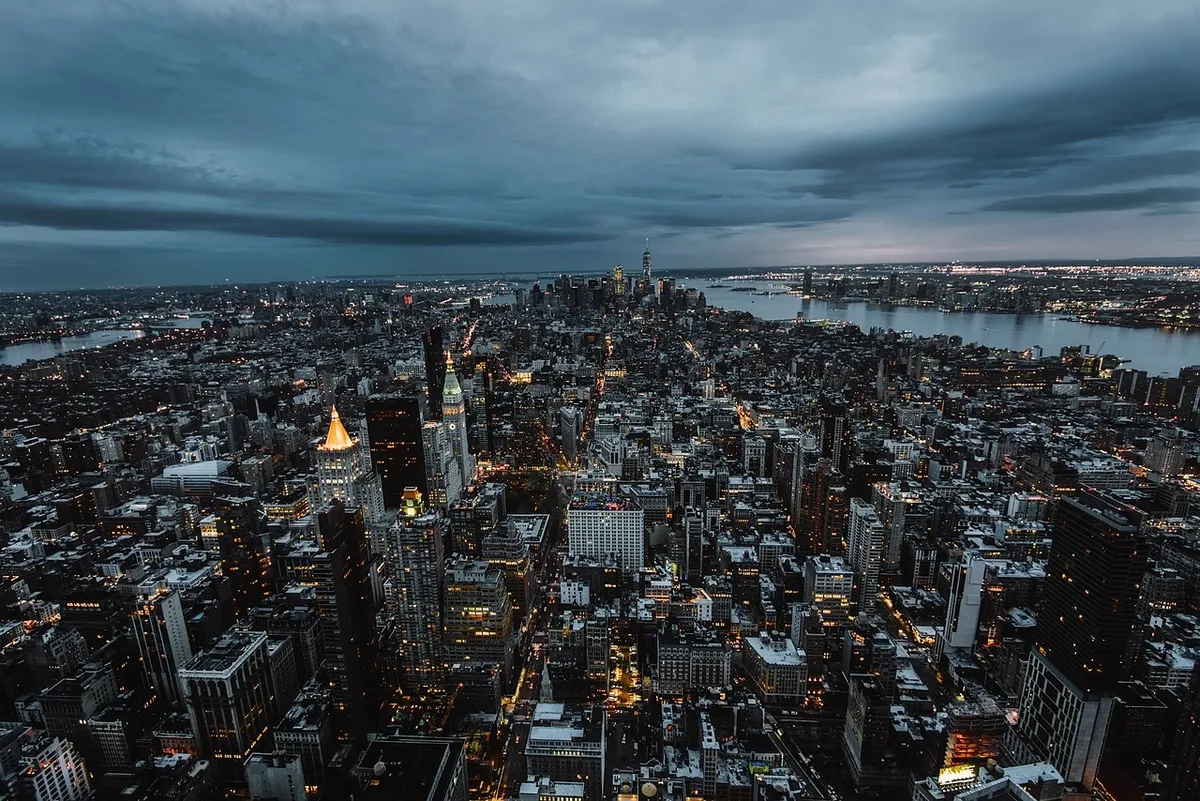
A limitation of these figures is that they represent snapshots in time, such as the 2020 data where Chinese New Yorkers were noted to be highly concentrated in specific boroughs. These statistics can change rapidly due to shifting economic and social factors.
- Why is the NYC foreign born population so significant?
- How is the NYC immigrant demographics shaped by specific neighborhoods?
- What are the different proportions within the NYC multicultural makeup?
The subject here is NYC foreign born population.
This part also covers Causes of NYC immigration.
This part also covers NYC multicultural society.
This part also covers NYC demographic diversity.
Causes of NYC immigration
Related
- How does the Philippine economy rank globally?
- NYC library education role: Vast holdings serve urban needs
How does the city's mosaic reflect its history?
The city's mosaic is a direct result of long-term global arrivals that began long before the present census data. The historical roots of this diversity are visible in the current distribution of residents across the boroughs.
This constant layering of different journeys contributes to the city's vibrant character.
- The presence of various ethnic groups found their unique spaces within the five boroughs over many decades. 2. The current proportions of different heritage groups are influenced by these past migratory patterns. 3. The city's identity is a living archive of this global movement.
Wikipedia: Mayor of New York City (full) Based on the retained excerpt mentioning New York State Communication Association: "The language of political genres: inaugural and state speeches of New York City Mayors and US Presidents." Proceedings of the New York State Communication Association 2017.1 (2021): 9+ online.


Comments 0